A while ago, it occurred to me that querying Debian Code Search seemed slow, which surprised me because I previously spent quite some effort on making it faster, see Debian Code Search Instant and Taming the latency tail for the most recent substantial architecture overhaul and related optimizations.
Upon taking a closer look, I realized that while performing the search query on the server side was pretty fast, the perceived slowness was due to the client side being slow. By “being slow”, I mean that it took a long time until something was drawn on the screen (high latency) and that what was happening on the screen was janky (stuttering, not smooth).
Part of that slowness was due to historical reasons: the client-side architecture was optimized for the use-case where users open Debian Code Search’s index page and then submit a search query, but I was using Chrome’s address bar to send a search query (type “codesearch”, then hit the TAB key). Further, we only added a non-JavaScript version after we launched the JavaScript version. Hence, the redirects and progressive enhancements we implemented are more of a kludge than a well thought out design.
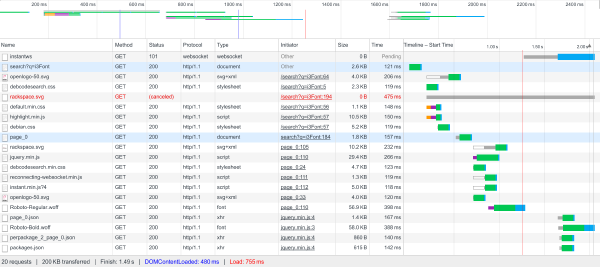
After this bit of original investigation, I opened GitHub issue #69 to track the work on making Debian Code Search faster. In that issue, I captured how Chrome’s network inspector visualizes the work necessary to render the page:

A couple of quick wins
There are a couple of little fixes and improvements on which I’m not going to spend too much time on, but which I list for completeness anyway just in case they come in handy for a similar project of yours:
- Remove css @import, unnecessary because we minify the two stylesheets together already.
- Compress assets using the gzip-compatible Zöpfli algorithm (saves 3KB).
-
Run SVG files through the
svgooptimizer (saves 8KB). - Use highly compressed/post-processed woff/woff2 webfont versions (gains such as 57KB→14KB for Roboto-Bold).
- Enabled HTTP/2 in nginx — not a win by itself, but avoids further round trips in combination with the EventSource API (see below).
Bigger changes
The URL pattern has changed. Previously, we had 2 areas of the website, one for JavaScript-compatible clients and one for the rest. When you hit the wrong one, you were redirected. In some areas, we couldn’t tell which area is the correct one for you, so you would always incur a redirect: one example for this is the search bar. With the new URL pattern, we deliver both versions under the same URL: the elements only used by the JavaScript code are hidden using CSS by default, then made visible by JavaScript code. The elements only used by the non-JavaScript code are wrapped in a <noscript> tag.
All CSS which is required for the initial page rendering is now inlined in the responses, allowing the browser to immediately render a response without requiring any additional round trips.
All non-essential CSS has been moved into a separate CSS file which is loaded asynchronously. This is done using a pattern like <link rel="preload" href="foo.css" as="style" onload="this.rel='stylesheet'">, see also filamentgroup/loadCSS.
We switched from WebSockets to the EventSource API because the former is not compatible with HTTP/2, whereas the latter is. This removes a round trip and some custom code for WebSocket reconnecting, because EventSource does that for you.
The progress bar animation used to animate the background-position property. It turns out that browsers can only animate the position, scale, rotation and opacity properties smoothly, because such animations can be off-loaded to the GPU. Hence, we have re-implemented the progress bar animation using the position property.
The biggest win for improving client-side latency from the Chrome address bar was introducing Service Workers (see commit 7f31aef402cb782056e290a797f224171f4af270). Our Service Worker caches static assets and a placeholder results page. The placeholder page is presented immediately when you start a search (e.g. from the address bar), making the first response immediate, i.e. rendered within 100ms. Having assets and the result page out of the way, the first round trip is used for actually doing the search, removing all unnecessary overhead.
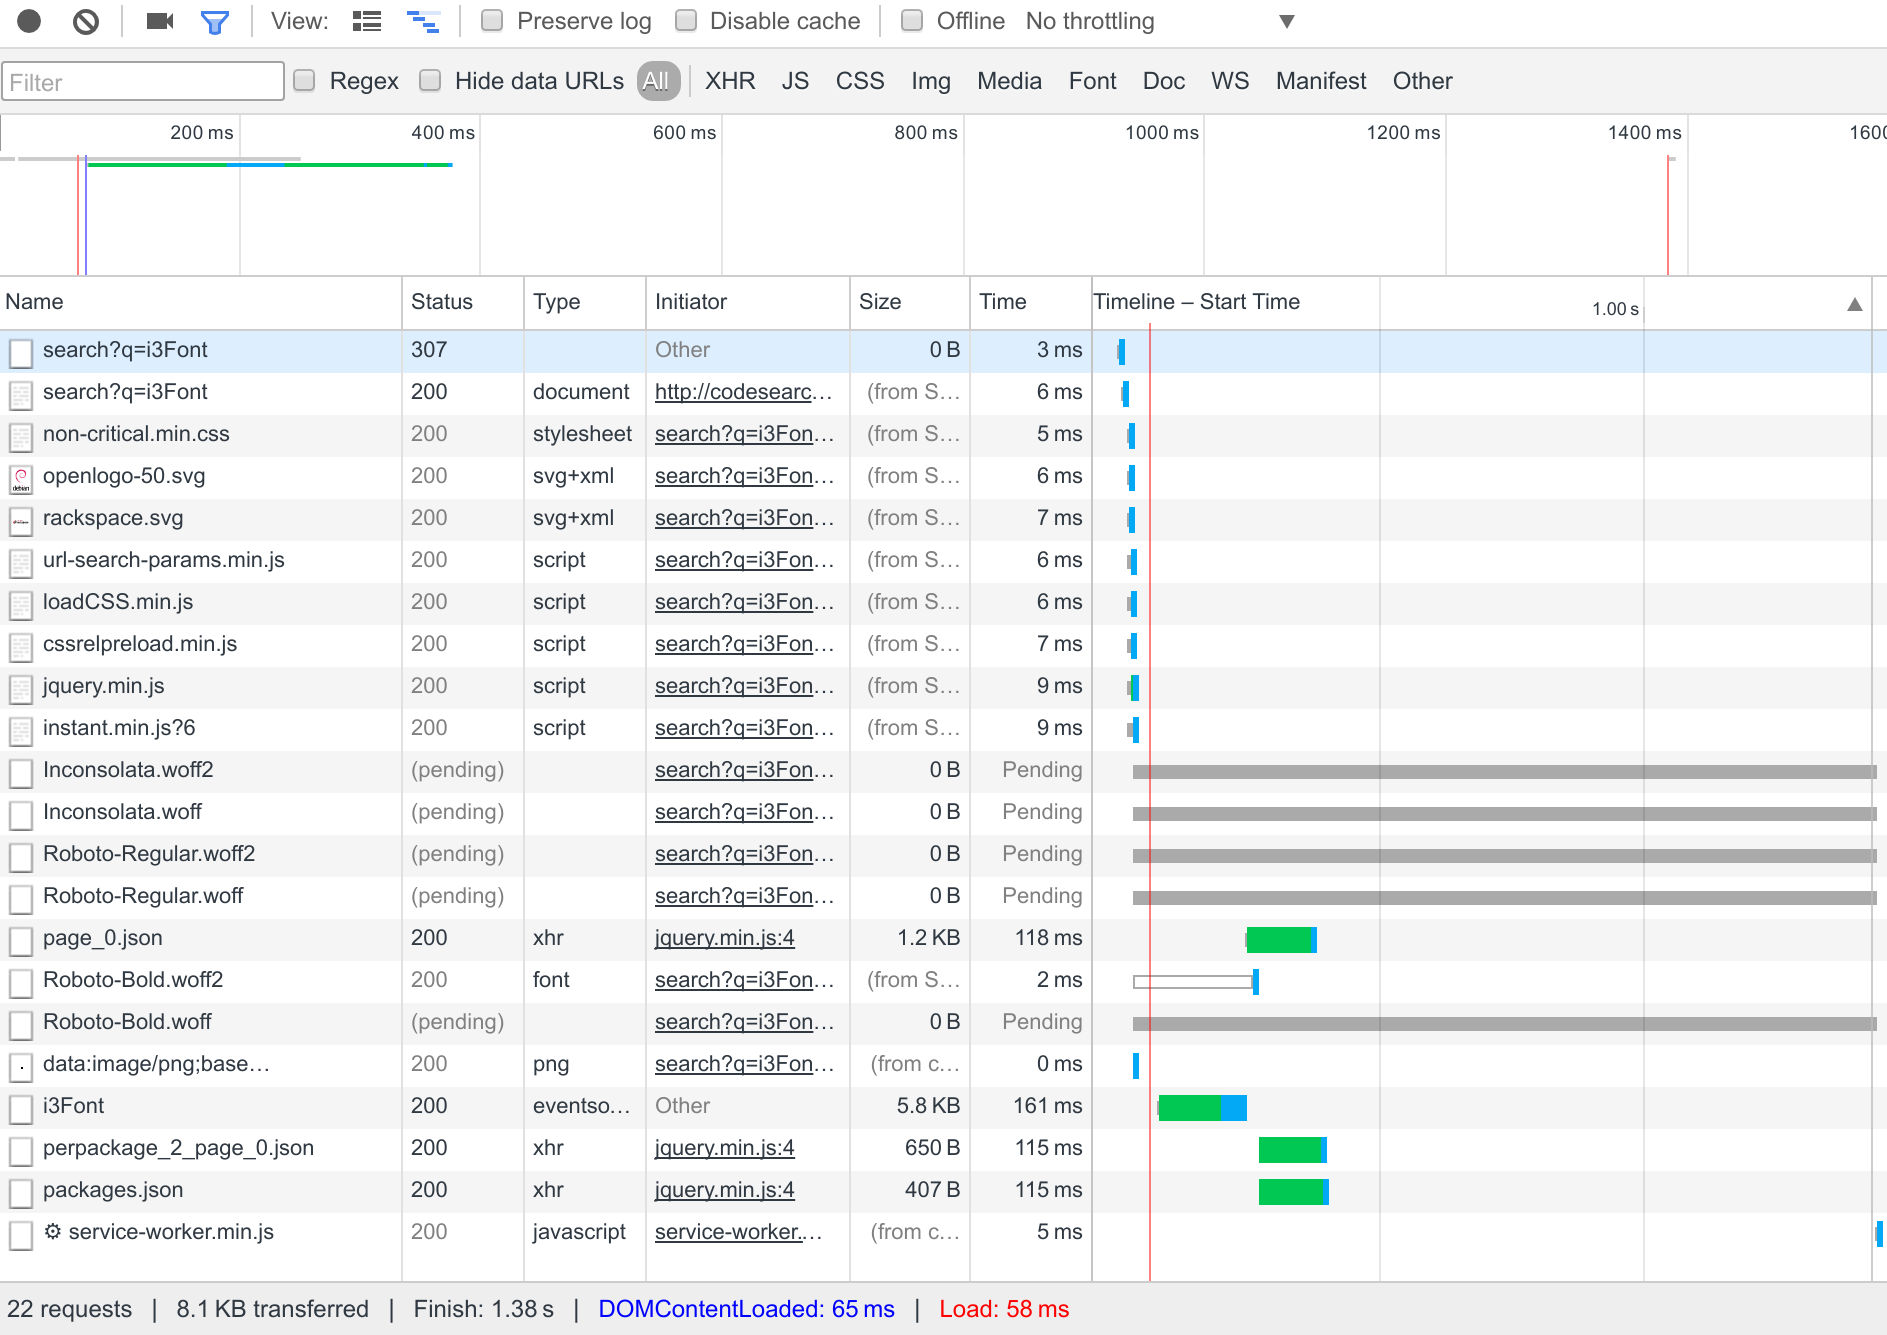
With all of these improvements in place, rendering latency goes down from half a second to well under 100 ms, and this is what the Chrome network inspector looks like:

Did you like this post? Subscribe to this blog’s RSS feed to not miss any new posts!
I run a blog since 2005, spreading knowledge and experience for over 20 years! :)
If you want to support my work, you can buy me a coffee.
Thank you for your support! ❤️